Field-service software for a company I co-own
McCool's Operations Platform
Internal operations platform for an Arizona pool-service company with 180+ accounts: a mobile-first technician portal, admin review workflows, performance dashboards, and an AI lead-intake bot — all built, shipped, and maintained by me.
- Context
- Founder / Operator
- Timeframe
- Ongoing
- Next.js
- React
- TypeScript
- MongoDB
- PWA
- Chart.js
- Azure Blob Storage
- GoHighLevel Conversation AI
- httpOnly cookie auth
The setting
I co-own McCool’s Pool Service — a real Arizona company with 180+ accounts and technicians in the field every day. I’m the technical half of the operation, which means I don’t get to hand off the hard parts: I design the tools, ship them, and then live with every bug alongside the people using them.
Before the platform, operations ran the way most small service companies run: texts, memory, and spreadsheets. Job notes lived in someone’s phone. Filter-cleaning schedules lived in someone’s head. The failure mode wasn’t dramatic — it was slow leaks: missed billables, forgotten follow-ups, no way to see which work was actually profitable.
What I built
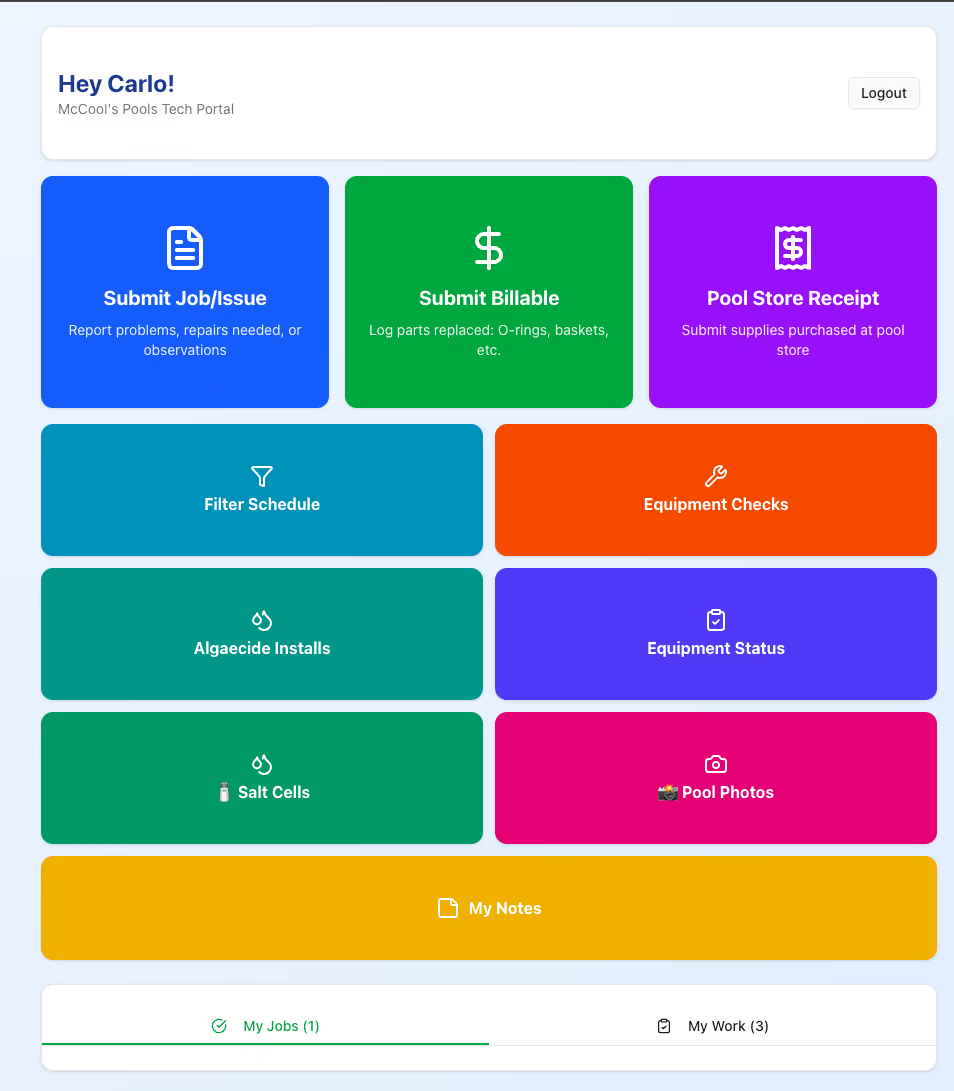
The technician portal. A Next.js + MongoDB app, built mobile-first as a PWA because the users are standing next to a pool in 110-degree heat, not sitting at a desk. Technicians submit jobs, billables, and notes with photos (uploads to Azure Blob Storage); role-based views keep techs, admins, and owners seeing exactly what they need. Auth uses httpOnly-cookie sessions — no tokens in localStorage, because habits from enterprise security reviews don’t turn off on weekends.
Admin review workflows. Submissions flow into a review queue instead of a group chat. Approvals, filter-cleaning schedules, and drain-service tracking became structured records with owners and dates instead of tribal knowledge. Job scheduling, dispatch, and the payroll and invoicing workflows sit on the same data — one system from the field visit to the invoice.
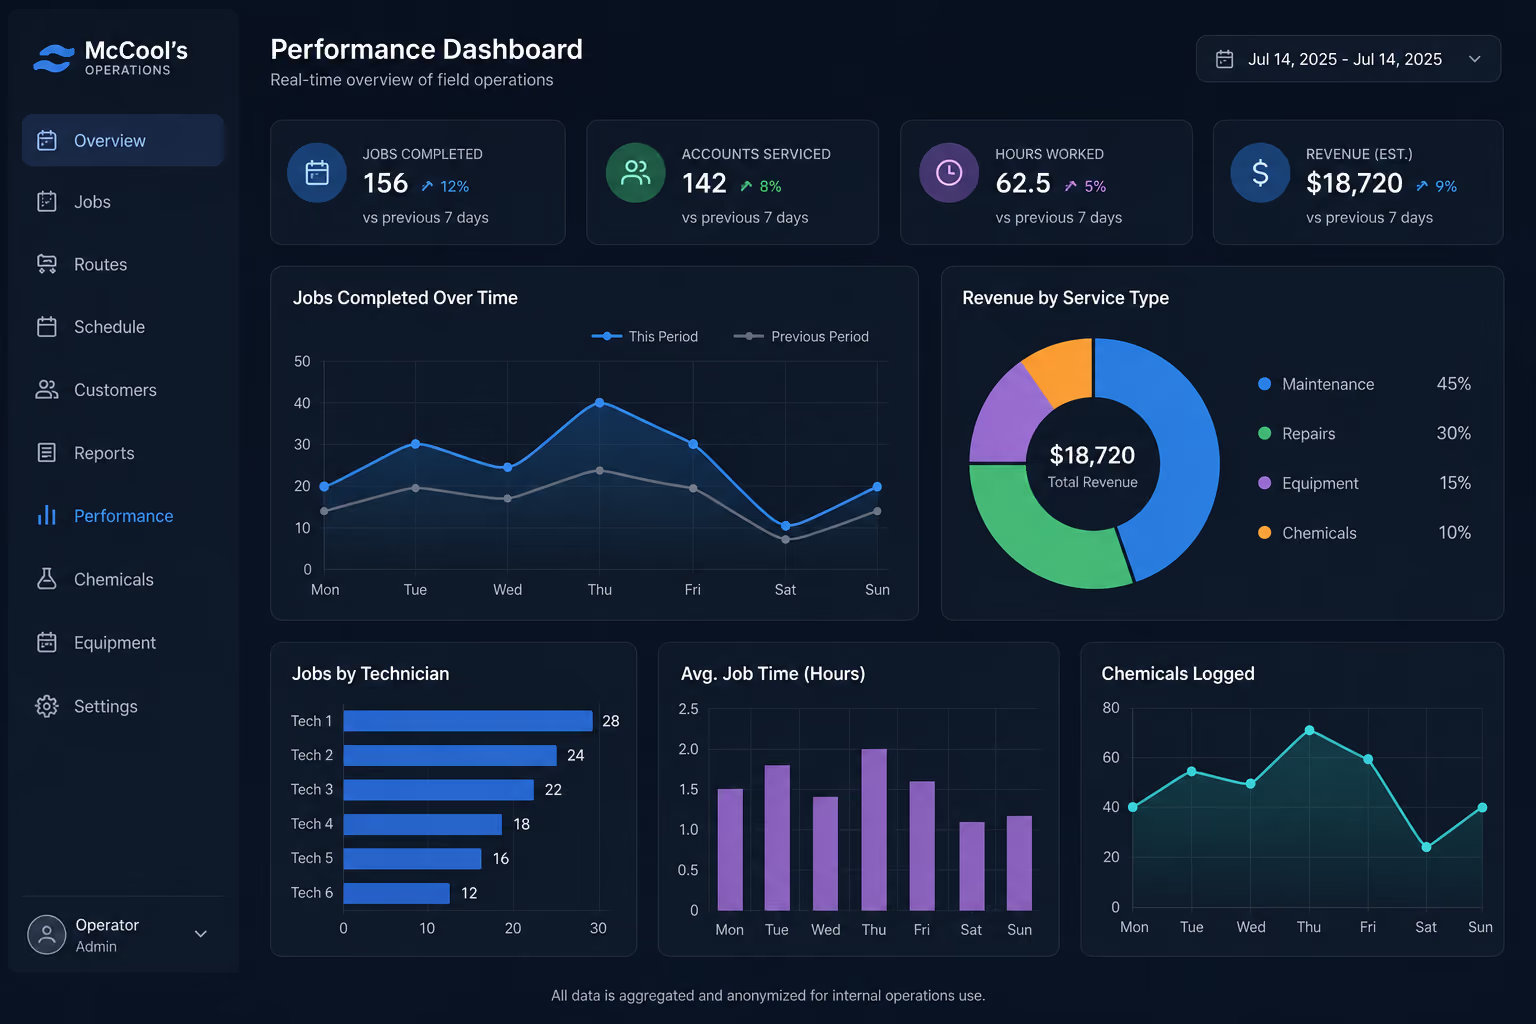
Performance dashboards. Chart.js dashboards built off real route data, showing per-technician output and the revenue mix between repair and maintenance work. The design goal for every chart: it has to be able to change a decision. If it can’t, it doesn’t ship.
Field operations
Lead intake
Alex, the AI lead-intake bot
Missed calls are the silent killer for local service businesses. I built “Alex” on GoHighLevel’s Conversation AI: it answers inbound leads, qualifies them, and feeds the CRM pipeline — 24/7, including the hours when everyone who could answer a phone is elbow-deep in a filter housing. It’s a small system with a very measurable job: leads that used to evaporate now become conversations.
Why this project matters to an employer
It’s easy to build a dashboard demo. It’s different to build software where the users are non-technical field technicians, the data is a live business’s revenue, and the person on call for every failure is you. This project is where product thinking, security habits, data modeling, and plain empathy for the end user all had to show up at once — and where I learned that adoption, not architecture, is the hard part of internal tools.